WnioskowanieStatystyczne/Bonferroni: Różnice pomiędzy wersjami
| Linia 1: | Linia 1: | ||
| − | + | ==Błędy I i II rodzaju== | |
| − | |||
| − | |||
| − | |||
| − | |||
Przyjęcie poziomu istotności (<math>\alpha</math>) na poziomie 5 procent oznacza, że średnio w jednym na dwadzieścia przypadków możemy odrzucić prawdziwą hipotezę, czyli popełnić '''błąd I rodzaju''' (false positive). | Przyjęcie poziomu istotności (<math>\alpha</math>) na poziomie 5 procent oznacza, że średnio w jednym na dwadzieścia przypadków możemy odrzucić prawdziwą hipotezę, czyli popełnić '''błąd I rodzaju''' (false positive). | ||
| Linia 32: | Linia 28: | ||
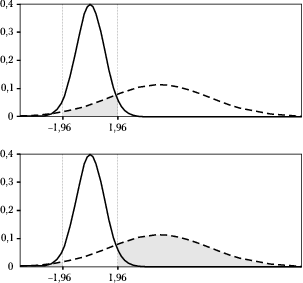
Na górnym wykresie zacieniowany obszar (o polu <math>\beta</math>) odpowiada prawdopodobieństwu błędnej akceptacji hipotezy alternatywnej (błąd II rodzaju, false nagative). Na dolnym zacieniowany obszar odpowiada prawdopodobieństwu odrzucenia hipotezy alternatywnej, czyli '''mocy testu''' (<math>1-\beta</math>) względem tej konkretnej hipotezy alternatywnej.]] | Na górnym wykresie zacieniowany obszar (o polu <math>\beta</math>) odpowiada prawdopodobieństwu błędnej akceptacji hipotezy alternatywnej (błąd II rodzaju, false nagative). Na dolnym zacieniowany obszar odpowiada prawdopodobieństwu odrzucenia hipotezy alternatywnej, czyli '''mocy testu''' (<math>1-\beta</math>) względem tej konkretnej hipotezy alternatywnej.]] | ||
| + | |||
| + | ==Wielokrotne porównania== | ||
| + | <math>N</math> obserwacji podzielonych na 7 grup. Testujemy hipotezę, że średnie tych grup są równe -- czyli niejako przyporządkowanie do grup jest przypadkowe. | ||
| + | Możemy wykonać <math>\binom{7}{2}=21</math> testów różnic między grupami. Jeśli przyjmiemy poziom istotności 0.05, mamy dużą szansę na dokonanie fałszywego odkrycia. | ||
Problem wielokrotnych porównań (ang. multiple comparisons) pojawia się w eksploracyjnej (w odróżnieniu od konfirmacyjnej) analizie danych, kiedy np. nie wiemy gdzie oczekiwać różnic. | Problem wielokrotnych porównań (ang. multiple comparisons) pojawia się w eksploracyjnej (w odróżnieniu od konfirmacyjnej) analizie danych, kiedy np. nie wiemy gdzie oczekiwać różnic. | ||
| Linia 40: | Linia 40: | ||
por. http://en.wikipedia.org/wiki/Data_dredging zwane też <math>p</math>-hacking. | por. http://en.wikipedia.org/wiki/Data_dredging zwane też <math>p</math>-hacking. | ||
| − | + | ||
| + | ==Evaluation of measurement data — Guide to the expression of uncertainty in measurement== | ||
JCGM 100:2008 GUM 1995 with minor corrections http://www.iso.org/sites/JCGM/GUM-JCGM100.htm | JCGM 100:2008 GUM 1995 with minor corrections http://www.iso.org/sites/JCGM/GUM-JCGM100.htm | ||
''3.4.8 Although this Guide provides a framework for assessing uncertainty, it cannot substitute for critical thinking, intellectual honesty and professional skill. The evaluation of uncertainty is neither a routine task nor a purely mathematical one; it depends on detailed knowledge of the nature of the measurand and of the measurement. The quality and utility of the uncertainty quoted for the result of a measurement therefore ultimately depend on the understanding, critical analysis, and integrity of those who contribute to the assignment of its value.'' | ''3.4.8 Although this Guide provides a framework for assessing uncertainty, it cannot substitute for critical thinking, intellectual honesty and professional skill. The evaluation of uncertainty is neither a routine task nor a purely mathematical one; it depends on detailed knowledge of the nature of the measurand and of the measurement. The quality and utility of the uncertainty quoted for the result of a measurement therefore ultimately depend on the understanding, critical analysis, and integrity of those who contribute to the assignment of its value.'' | ||
Wersja z 17:30, 4 maj 2017
Błędy I i II rodzaju
Przyjęcie poziomu istotności ([math]\alpha[/math]) na poziomie 5 procent oznacza, że średnio w jednym na dwadzieścia przypadków możemy odrzucić prawdziwą hipotezę, czyli popełnić błąd I rodzaju (false positive).
Dla kompletności przypomnijmy, że błąd II rodzaju polega na przyjęciu hipotezy fałszywej (false negative) i jest związany z poziomem istotności testu.
| hipoteza H0 | |||
|---|---|---|---|
| Prawdziwa | Fałszywa | ||
| decyzja | Odrzuć | Błąd typu I (False Positive) | poprawna (True Positive) |
| Przyjmij | poprawna (True Negative) | Błąd typu II (False Negative) | |

Wielokrotne porównania
[math]N[/math] obserwacji podzielonych na 7 grup. Testujemy hipotezę, że średnie tych grup są równe -- czyli niejako przyporządkowanie do grup jest przypadkowe. Możemy wykonać [math]\binom{7}{2}=21[/math] testów różnic między grupami. Jeśli przyjmiemy poziom istotności 0.05, mamy dużą szansę na dokonanie fałszywego odkrycia.
Problem wielokrotnych porównań (ang. multiple comparisons) pojawia się w eksploracyjnej (w odróżnieniu od konfirmacyjnej) analizie danych, kiedy np. nie wiemy gdzie oczekiwać różnic.
Korekcja Bonferroniego polega na podzieleniu poziomu istotności przez liczbę porównań. Jest mocno konserwatywna.
por. http://en.wikipedia.org/wiki/Data_dredging zwane też [math]p[/math]-hacking.
Evaluation of measurement data — Guide to the expression of uncertainty in measurement
JCGM 100:2008 GUM 1995 with minor corrections http://www.iso.org/sites/JCGM/GUM-JCGM100.htm
3.4.8 Although this Guide provides a framework for assessing uncertainty, it cannot substitute for critical thinking, intellectual honesty and professional skill. The evaluation of uncertainty is neither a routine task nor a purely mathematical one; it depends on detailed knowledge of the nature of the measurand and of the measurement. The quality and utility of the uncertainty quoted for the result of a measurement therefore ultimately depend on the understanding, critical analysis, and integrity of those who contribute to the assignment of its value.